

绘图区域
绘图区域是绘制数据点的图表区域。在具有 X 轴和 Y 轴的图表中,绘图区也指轴覆盖的区域。在饼图或旭日图等图表中,绘图区域是指图表本身实际覆盖的圆形区域。
在 FlexChart
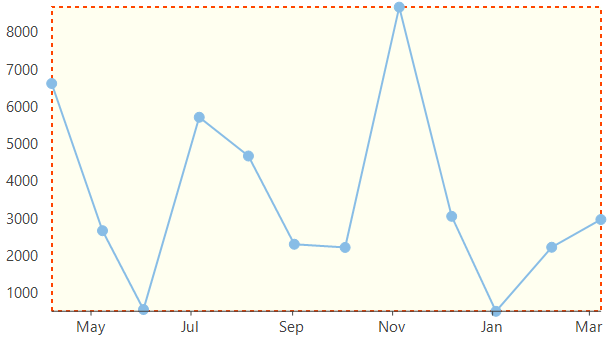
中,绘图区以基本的白色背景色呈现。但是,您可以使用图表样式类型的打印样式属性自定义绘图区的外观以满足您的要求。类提供用于设置填充、填充颜色、线条图案、描边、描边宽度、描边虚线图案等的属性。
| Vb.Net |
'Setting color that fills the plot area flexChart1.PlotStyle.Fill = New SolidBrush(Color.LightGray) 'Setting brush to be used for stroke pattern flexChart1.PlotStyle.Stroke = Brushes.DarkBlue 'Setting width to be used for stroke pattern flexChart1.PlotStyle.StrokeWidth = 2.0F 'Setting pattern to be used stroke flexChart1.PlotStyle.LinePattern = C1.Chart.LinePatternEnum.Dash |
| C# |
//Setting color that fills the plot area flexChart1.PlotStyle.Fill = new SolidBrush(Color.Ivory) ; //Setting brush to be used for stroke pattern flexChart1.PlotStyle.Stroke = Brushes.OrangeRed; //Setting width to be used for stroke pattern flexChart1.PlotStyle.StrokeWidth = 2.0f; //Setting pattern to be used stroke flexChart1.PlotStyle.LinePattern = C1.Chart.LinePatternEnum.Dash; |
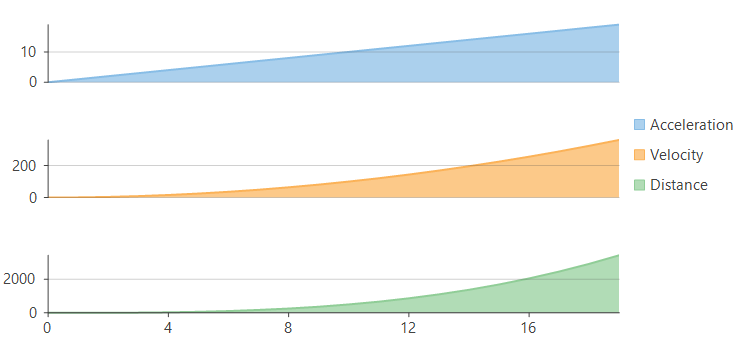
多个绘图区域比多个重叠序列更具优势,因为它们提高了数据的可读性,从而有助于更好地分析。绘制多个系列,每个绘图区一个,同时共享一些图表资源,如轴、图例等。在下图所示的场景中很有帮助,该图表演示了加速度、速度和距离相对于时间序列的变化。在 FlexChart 中,通过将绘图区域添加到 PlotAreas 集合,并在定义序列时指定必须在其中呈现相同内容的绘图名称,可以实现多个绘图区。FlexChart 还提供了用于设置每个绘图区域的高度、宽度、行索引和列索引的属性。
Vb.Net
'Add new PlotAreas to FlexChart, Row property decides where to place the PlotArea
flexChart1.PlotAreas.Add(New PlotArea() With {
      .Name = "plot1",
      .Row = 1
})
flexChart1.PlotAreas.Add(New PlotArea() With {
      .Name = "plot2",
      .Row = 3
})
flexChart1.PlotAreas.Add(New PlotArea() With {
      .Name = "plot3",
      .Row = 5
})

'Create new series for Acceleration and set PlotAreaName specifying in which plot to render this series
Dim acceleration As Series = New Series() With {
      .Name = "Acceleration",
      .DataSource = CreateDataPoints(Function(x) x, Function(y) y, 20),
      .AxisY = New Axis() With {
          .Position = Position.Left,
          .MajorGrid = True,
          .PlotAreaName = "plot1"
    }
}
flexChart1.Series.Add(acceleration)

'Create new series for Velocity and set PlotAreaName specifying in which plot to render this series
Dim velocity As Series = New Series() With {
      .Name = "Velocity",
      .DataSource = CreateDataPoints(Function(x) x, Function(y) y * y, 20),
      .AxisY = New Axis() With {
          .Position = Position.Left,
          .MajorGrid = True,
          .PlotAreaName = "plot2"
    }
}
flexChart1.Series.Add(velocity)

'Create new series for distance and set PlotAreaName specifying in which plot to render this series
Dim distance As Series = New Series() With {
      .Name = "Distance",
      .DataSource = CreateDataPoints(Function(x) x, Function(y) 0.5 * y * y * y, 20),
      .AxisY = New Axis() With {
          .Position = Position.Left,
          .MajorGrid = True,
          .PlotAreaName = "plot3"
    }
}
flexChart1.Series.Add(distance)
| C# |
//Add new PlotAreas to FlexChart, Row property decides where to place the PlotArea flexChart1.PlotAreas.Add(new PlotArea { Name = "plot1", Row = 1 }); flexChart1.PlotAreas.Add(new PlotArea { Name = "plot2", Row = 3 }); flexChart1.PlotAreas.Add(new PlotArea { Name = "plot3", Row = 5 }); //Create new series for Acceleration and set PlotAreaName specifying in which plot to render this series var acceleration = new Series { Name = "Acceleration", DataSource = CreateDataPoints((x) => x, (y) => y, 20), AxisY = new Axis {Position = Position.Left, MajorGrid = true, PlotAreaName = "plot1"} }; flexChart1.Series.Add(acceleration); //Create new series for Velocity and set PlotAreaName specifying in which plot to render this series var velocity = new Series { Name = "Velocity", DataSource = CreateDataPoints((x) => x, (y) => y * y, 20), AxisY = new Axis {Position = Position.Left, MajorGrid = true, PlotAreaName = "plot2"} }; flexChart1.Series.Add(velocity); //Create new series for distance and set PlotAreaName specifying in which plot to render this series var distance = new Series { Name = "Distance", DataSource = CreateDataPoints((x) => x, (y) => 0.5 * y * y * y, 20), AxisY = new Axis {Position = Position.Left, MajorGrid = true, PlotAreaName = "plot3"} }; flexChart1.Series.Add(distance); |
请注意,上面的示例代码使用名为 CreateDataPoint
的自定义方法来生成随机数据。您可以根据需要设置数据源。