

Legend图例
图例是一个图表元素,它显示与该图表上绘制的每个数据系列相对应的颜色、符号和文本列表。它有助于理解和分析多个图系情况下的绘图数据。
在FlexChart中,如果设置了系列的“Name名称”属性,则会自动显示图例。换句话说,需要系列的 Name 属性来生成与相同的图例条目。此外,FlexChart会根据图表上的可用空间自动放置图例。但是,也可以通过设置 Position 属性将其设置为相对于绘图区的顶部、底部、左侧或右侧显示。为了以最优化的方式使用可用空间,FlexChart 在放置在绘图区的顶部或底部时水平显示图例,在放置在绘图区的左侧或右侧时垂直显示图例。同时,FlexChart还允许您根据需要设置方向。
| Vb.Net |
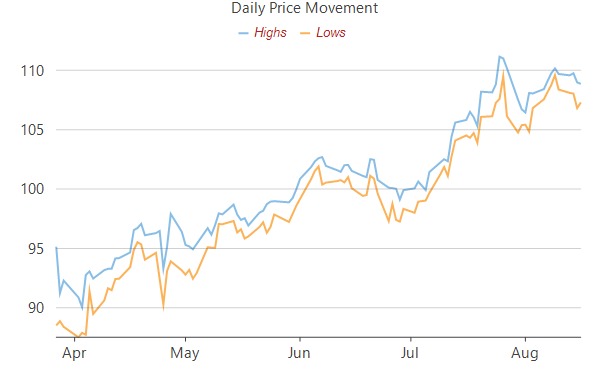
'获得图表控件的引用 Dim flexChart1 As SmFlexChart= Proj.OpenedForms("图表").ControlDictionary()("SmFlexChart1") '先清空之前的图系 flexChart1.Series.Clear() '设置图表类型为Line flexChart1.ChartType =C1.Chart.ChartType.Line '设置图表的标题 flexChart1.Header.Content = "Daily Price Movement" '将FlexChart的AxisX绑定到“Name”,以便数据名称显示在横轴中 flexChart1.BindingX = "Date" '创建和添加多个系列,一个用于Highs,一个为Lows flexChart1.Series.Add(New SmSeries() With { .Binding = "High", .Name = "Highs" }) flexChart1.Series.Add(New SmSeries() With { .Binding = "Low", .Name = "Lows" }) '绑定数据 Dim db As Database=Proj.SysDataFactory("UserDB") Dim dt As DataTable=db.ExecuteDataTable("select * from DailyPriceMovement") flexChart1.DataSource = dt '设置图例位置和方向 flexChart1.Legend.Position = C1.Chart.Position.Top flexChart1.Legend.Orientation = C1.Chart.Orientation.Horizontal |
| C# |
// 获得图表控件的引用 SmFlexChart flexChart1 = Proj.OpenedForms["图表"].ControlDictionary()["SmFlexChart1"] as SmFlexChart; // 先清空之前的图系 flexChart1.Series.Clear(); // 设置图表类型为Line flexChart1.ChartType = C1.Chart.ChartType.Line; // 设置图表的标题 flexChart1.Header.Content = "Daily Price Movement"; // 将FlexChart的AxisX绑定到“Name”,以便数据名称显示在横轴中 flexChart1.BindingX = "Date"; // 创建和添加多个系列,一个用于Highs,一个为Lows flexChart1.Series.Add(new SmSeries() { Binding = "High", Name = "Highs" }); flexChart1.Series.Add(new SmSeries() { Binding = "Low", Name = "Lows" }); // 绑定数据 Database db = Proj.SysDataFactory["UserDB"]; DataTable dt = db.ExecuteDataTable("select * from DailyPriceMovement"); flexChart1.DataSource = dt; // 设置图例位置和方向 flexChart1.Legend.Position = C1.Chart.Position.Top; flexChart1.Legend.Orientation = C1.Chart.Orientation.Horizontal; |
使用FlexChart,如果FlexChart类的LegendToggle(切换图例)属性设置为True,用户甚至可以通过在运行时单击相应的图例条目来切换数据系列的可见性。
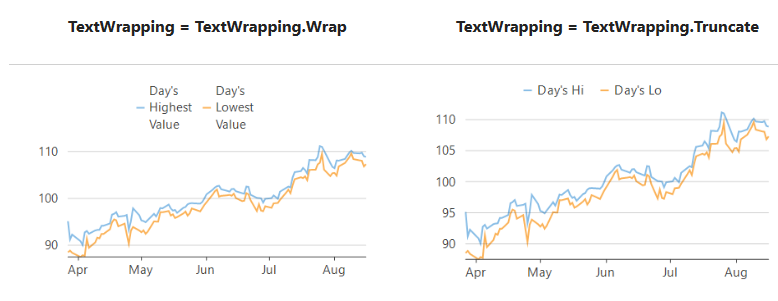
有时没有足够的空间来显示图表区域中图例条目的完整文本。FlexChart 提供 Legend 类的 TextWrapping 属性,该属性允许您在文本宽度超过 ItemMaxWidth 属性中指定的值时换行或裁切文本。属性TextWrapping接受来自TextWrapping(文本换行)枚举的值。
| Vb.Net |
'Wrap the legend if text width exceeds the maximum limit
flexChart1.Legend.ItemMaxWidth = 70
flexChart1.Legend.TextWrapping = TextWrapping.Wrap |
| C# |
//Wrap the legend if text width exceeds the maximum limit
flexChart1.Legend.ItemMaxWidth = 70;
flexChart1.Legend.TextWrapping = TextWrapping.Wrap; |
FlexChart 还允许您使用 Legend 类的 Style 属性设置图例和图例条目的样式。此属性允许您为图例指定填充、填充颜色、描边宽度、描边颜色等。
| Vb.Net |
'Styling Legends flexChart1.Legend.Style.Font = New Font("Arial", 10, FontStyle.Italic) flexChart1.Legend.Style.StrokeWidth = 0.75F flexChart1.Legend.Style.StrokeColor = Color.Firebrick |
| C# |
//Styling Legends flexChart1.Legend.Style.Font = new Font("Arial", 10, FontStyle.Italic); flexChart1.Legend.Style.StrokeWidth = 0.75f; flexChart1.Legend.Style.StrokeColor = Color.Firebrick; |
图例分组()是指根据图例条目提供的数据对图例条目进行分类。此功能通常有助于在多个堆叠序列的情况下识别数据系列的类别。例如,在同一图表区中绘制多个季度的销售额和利润时,图例组有助于识别哪些序列是销售序列,哪些序列是利润序列。
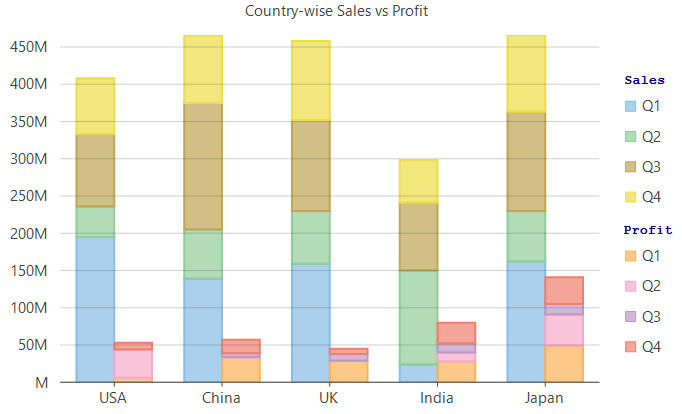
若要使用 FlexChart 创建图例组,该控件提供了 LegendGroup 属性,该属性接受字符串值并将具有相同值的图系组合在一起。此属性的值不仅充当组名称,还充当组标题,该标题显示在相应图例组的顶部。未指定 LegendGroup 属性的图系将被视为第 0 个组的一部分,并且在没有任何组标题的情况下显示。FlexChart 还允许您使用 Legend 类的 GroupHeaderStyle 属性自定义图例组标题。
| Vb.Net |
'Specify group for each series flexChart1.Series(0).LegendGroup = "Sales" flexChart1.Series(1).LegendGroup = "Profit" flexChart1.Series(2).LegendGroup = "Sales" flexChart1.Series(3).LegendGroup = "Profit" flexChart1.Series(4).LegendGroup = "Sales" flexChart1.Series(5).LegendGroup = "Profit" flexChart1.Series(6).LegendGroup = "Sales" flexChart1.Series(7).LegendGroup = "Profit" ' stylise legend group header flexChart1.Legend.GroupHeaderStyle.Stroke = Brushes.DarkBlue flexChart1.Legend.GroupHeaderStyle.Font = New Font(FontFamily.GenericMonospace, 10F, FontStyle.Bold) |
| C# |
//Specify group for each series flexChart1.Series[0].LegendGroup = "Sales"; flexChart1.Series[1].LegendGroup = "Profit"; flexChart1.Series[2].LegendGroup = "Sales"; flexChart1.Series[3].LegendGroup = "Profit"; flexChart1.Series[4].LegendGroup = "Sales"; flexChart1.Series[5].LegendGroup = "Profit"; flexChart1.Series[6].LegendGroup = "Sales"; flexChart1.Series[7].LegendGroup = "Profit"; // stylise legend group header flexChart1.Legend.GroupHeaderStyle.Stroke = Brushes.DarkBlue; flexChart1.Legend.GroupHeaderStyle.Font = new Font(FontFamily.GenericMonospace, 10f, FontStyle.Bold); |