

如何:更改序列点的外观
本主题介绍如何设置序列点的格式。
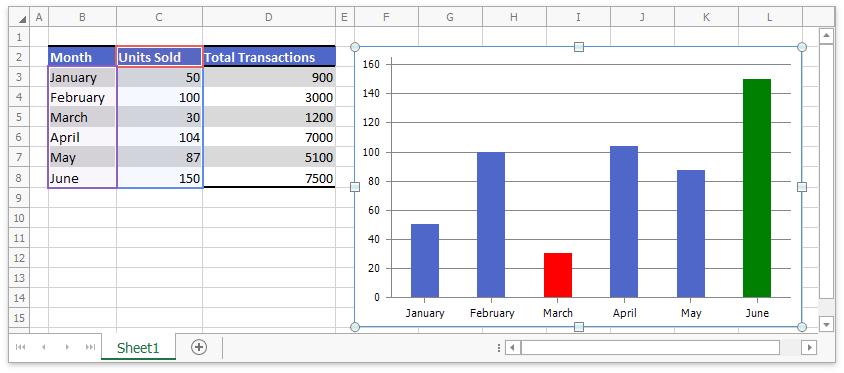
若要更改数据点的外观,请向 Series.CustomDataPoints 集合添加一个新项,其索引等于序列中已修改数据点的从零开始的位置。然后,使用以下成员指定数据点的填充和轮廓设置:
| Vb.Net |
'创建图表并指定其位置。 Dim chart As DevExpress.Spreadsheet.Charts.Chart = worksheet.Charts.Add(DevExpress.Spreadsheet.Charts.ChartType.ColumnClustered, worksheet("B2:C8")) chart.TopLeftCell = worksheet.Cells("F2") chart.BottomRightCell = worksheet.Cells("L15") '隐藏图表的图例。 chart.Legend.Visible = False '用红色填充第三个数据点。 chart.Series(0).CustomDataPoints.Add(2).Fill.SetSolidFill(Color.Red) '用绿色填充第六个数据点。 chart.Series(0).CustomDataPoints.Add(5).Fill.SetSolidFill(Color.Green) |
| C# |
// 创建图表并指定其位置。 DevExpress.Spreadsheet.Charts.Chart chart = worksheet.Charts.Add(DevExpress.Spreadsheet.Charts.ChartType.ColumnClustered, worksheet["B2:C8"]); chart.TopLeftCell = worksheet.Cells["F2"]; chart.BottomRightCell = worksheet.Cells["L15"]; // 隐藏图表的图例。 chart.Legend.Visible = false; // 用红色填充第三个数据点。 chart.Series[0].CustomDataPoints.Add(2).Fill.SetSolidFill(Color.Red); // 用绿色填充第六个数据点。 chart.Series[0].CustomDataPoints.Add(5).Fill.SetSolidFill(Color.Green); |
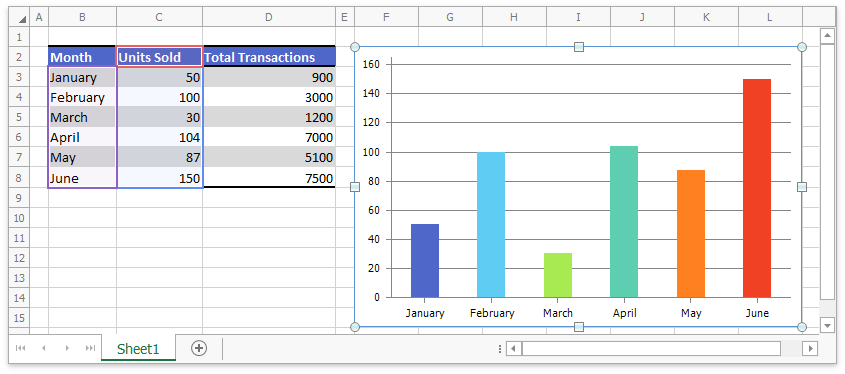
下面的示例演示如何使用 ChartView.VaryColors 属性将不同的颜色应用于系列中的每个数据标记。
| Vb.Net |
'创建图表并指定其位置。 Dim chart As DevExpress.Spreadsheet.Charts.Chart = worksheet.Charts.Add(DevExpress.Spreadsheet.Charts.ChartType.ColumnClustered, worksheet("B2:C8")) chart.TopLeftCell = worksheet.Cells("F2") chart.BottomRightCell = worksheet.Cells("L15") '指定序列中的每个数据点具有不同的颜色。 chart.Views(0).VaryColors = True '隐藏图例。 chart.Legend.Visible = False |
| C# |
// 创建图表并指定其位置。 DevExpress.Spreadsheet.Charts.Chart chart = worksheet.Charts.Add(DevExpress.Spreadsheet.Charts.ChartType.ColumnClustered, worksheet["B2:C8"]); chart.TopLeftCell = worksheet.Cells["F2"]; chart.BottomRightCell = worksheet.Cells["L15"]; // 指定序列中的每个数据点具有不同的颜色。 chart.Views[0].VaryColors = true; // 隐藏图例。 chart.Legend.Visible = false; |