

Help >
开发指南 > 窗体开发 > 控件参考 > 控件参考 > 图表 > SmFlexChart > 属性 >
提示
当用户将鼠标悬停在图表中的数据点上时,将显示图表中的工具提示,从而使图表更具解释性,而不会造成任何视觉混乱。默认情况下,弹性图表显示一个工具提示,显示数据点的系列名称和值。但是,您也可以轻松自定义和格式化这些工具提示,以使它们更加翔实和清晰。
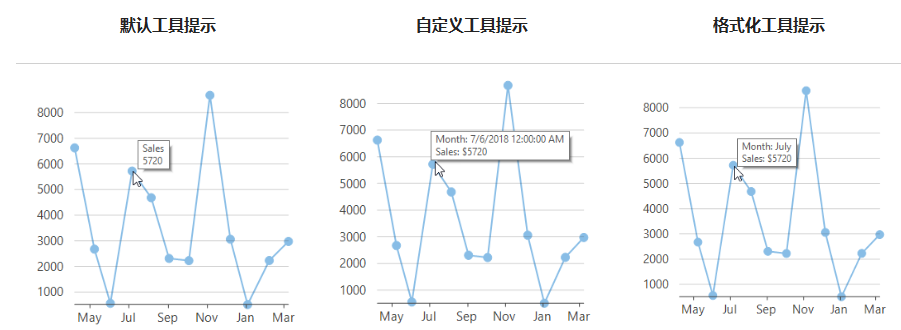
FlexChart 允许您通过在 Content 属性中分配模板字符串来自定义工具提示。您可以使用以下预定义参数来创建模板字符串。例如,您可以显示带有 x 值和 y 值及其系列名称的工具提示。
| 参数 | 描述 |
| x | 指数据点的 X 值。 |
| y | 请参阅数据点的 Y 值。 |
| value | 指数据点的值。 |
| name | 引用数据点的名称。 |
| seriesName | 引用包含数据点的系列的名称。 |
| pointIndex | 指数据点的索引。 |
| propertyName | 引用由点表示的数据对象的属性。 |
| Vb.Net |
'Customizing tooltip's Content to show both Axis label along with values flexChart1.ToolTip.Content = "Month: {Date}" & vbLf & "{seriesName}: ${Revenue}" |
| C# |
//Customizing tooltip's Content to show both Axis label along with values flexChart1.ToolTip.Content = "Month: {Date}\n{seriesName}: ${Revenue}"; |
FlexChart 允许您通过在分配给 Content 属性的模板字符串本身中指定格式来设置正在显示的数据的格式。例如,您可以使用所需的货币、分隔符或偶数位来格式化销售额或费用数字。您还可以使用各种日期格式(长整型和短型)来显示时间序列的值。
| Vb.Net |
'In tooltip, formatting AxisX field 'Date' of type DateTime to show only its Month component flexChart1.ToolTip.Content = "Month: {Date:MMMM}" & vbLf & "{seriesName}: ${Revenue}" |
| C# |
//In tooltip, formatting AxisX field 'Date' of type DateTime to show only its Month component flexChart1.ToolTip.Content = "Month: {Date:MMMM}\n{seriesName}: ${Revenue}"; |
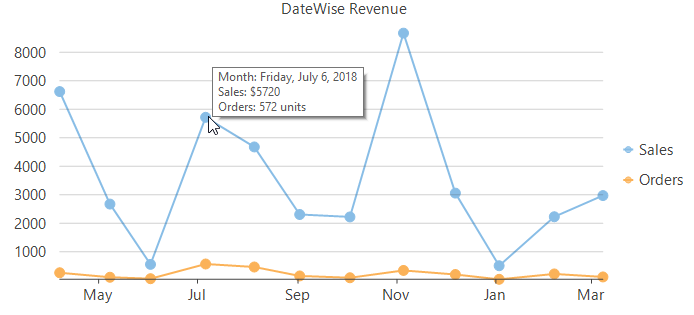
共享工具提示(即多个序列的单个工具提示)可用于根据特定 x 值显示所有序列的数据值。FlexChart 允许您自定义 Content 属性,以使用自定义工具提示部分中讨论的参数显示多个序列的数据值。
| Vb.Net |
'Customizing tooltip's Content to show both Axis label along with values flexChart1.ToolTip.Content = "Month: {Date:D}" & vbLf & "{seriesName}: ${Revenue}" & vbLf & "Orders: {Orders} units" |
| C# |
'Customizing tooltip's Content to show both Axis label along with values flexChart1.ToolTip.Content = "Month: {Date:D}" & vbLf & "{seriesName}: ${Revenue}" & vbLf & "Orders: {Orders} units" |